Dear Fellow Investor:
As we head into the second quarter of 2025, uncertainty continues to dominate market narratives. The U.S. economy finds itself in a precarious situation as economic growth and inflation concerns created significant volatility in the stock market last quarter.
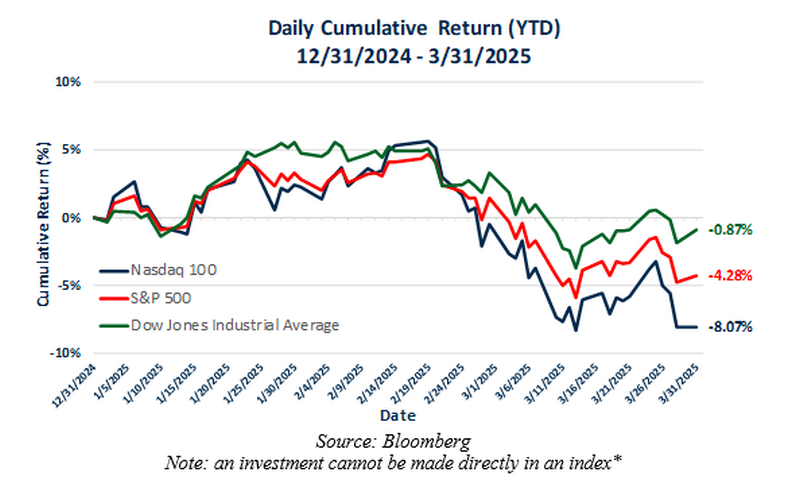
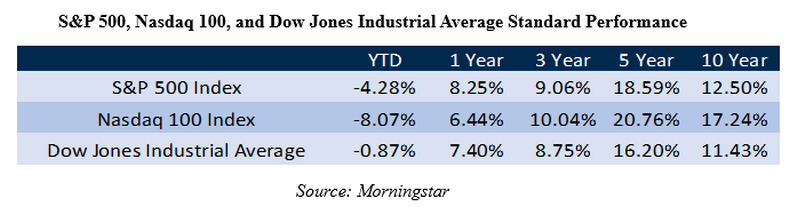
During Q1, the S&P 500 and Nasdaq 100 indices both entered correction territory, declining over 10% peak to trough. The S&P 500 experienced a -10.04% peak to trough drawdown, while the Nasdaq 100 peak to trough drawdown was -13.24%. The Dow Jones Industrial Average approached a correction, experiencing a -8.78% peak to trough drawdown.
Overall, the S&P 500 finished the quarter down -4.28% and the Nasdaq 100 suffered greater losses down -8.07%, whereas the Dow Jones Industrial Average only fell -0.87%.
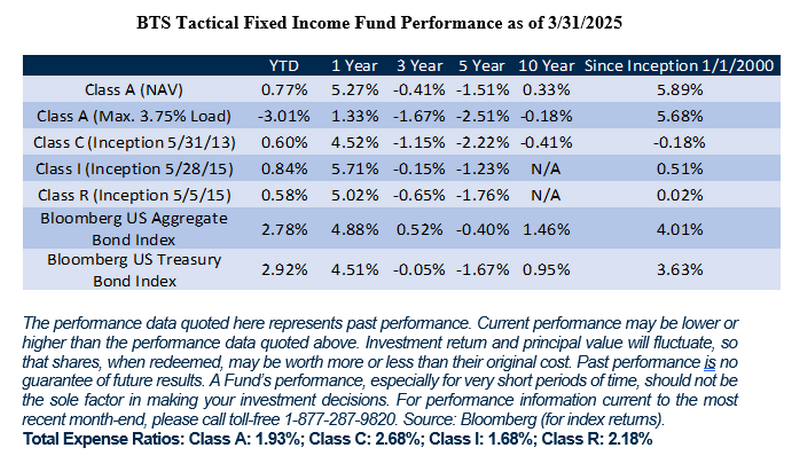
BTS believes stocks still face significant headwinds from tariffs and an uncertain interest rate policy path as we head into the rest of 2025. At this juncture, we believe adding bond exposure via our BTS Tactical Fixed Income Fund may offer a hedge against further stock and bond market volatility, as well as the rising risk of recession. The BTS Tactical Fixed Income Class I shares returned +0.84% in Q1 2025 (01/01/2025 – 3/31/2025), as high yield bonds remained resilient against stocks and did not discount defaults from declining economic growth, however, the risk of defaults has substantially risen at the start of Q2 2025.
High yield spreads over U.S. Treasuries typically widen during heighted economic risk, such as in the Great Financial Crisis in 2008-09 and most recently during the COVID-19 Pandemic in 2020 as uncertainty around bond defaults increases. Credit spreads have risen substantially off their lows of 2.56% on February 18th 2025 to over 4% as of 4/4/2025.
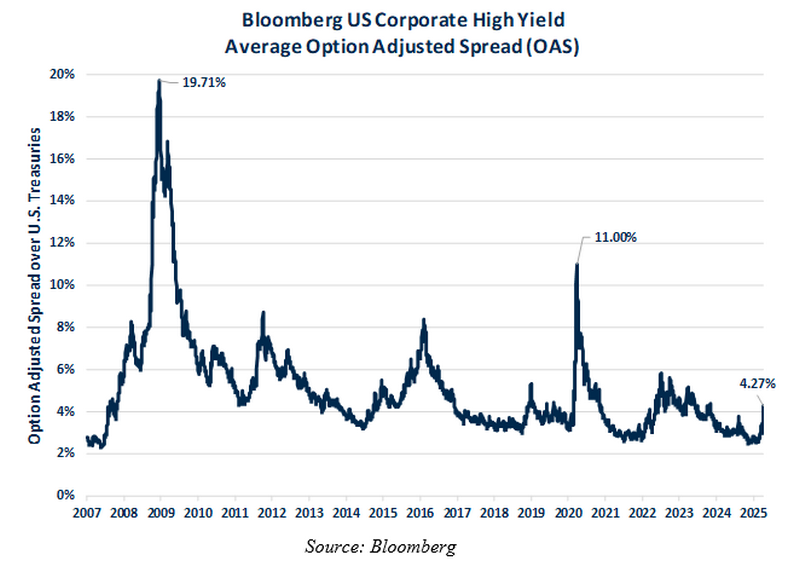
BTS believes that this rise in credit spreads, along with subsequent price declines in the high yield bond market and strength in U.S. treasuries, are indicating a high risk of recession this year. During Q1 2025, BTS added 20% treasury exposure in the 7–10-year duration range and subsequently reduced high yield exposure to 80% as our tactical models indicated heighted market risk as treasuries rallied. Treasuries saw significant price strength last quarter with the Bloomberg U.S. Treasury Index increasing +2.92%.
In early Q2 2025, the BTS Tactical Fixed Income Fund moved out of our remaining high yield bond position and fully into treasury bonds in an attempt to hedge against both market and recession risks.
Additionally, BTS believes the risk of recession and interest rate volatility may disproportionately affect growth stocks sensitive to valuations determined by discounted future cash flows and positive economic momentum. BTS recommends diversifying equity exposure into high-quality dividend value stocks and value stocks with strong balance sheets in order to reduce volatility. We aim to allocate to these types of value stocks in the strategies of the BTS Enhanced Equity Income Fund described in the graphic below.
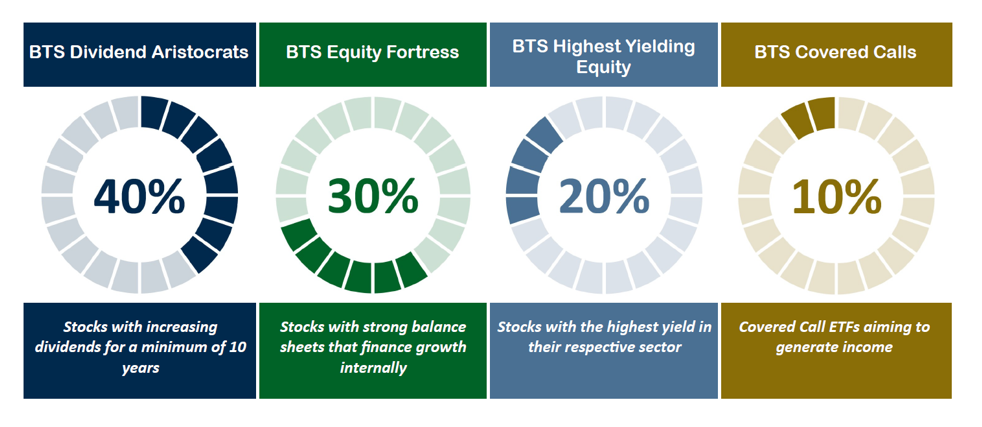
Growth stocks, such as the Magnificent 7, constitute a large part of the S&P 500 Index, therefore the BTS Enhanced Equity Income Fund seeks to offer diversification against the S&P 500’s growth risk through a blend of innovative strategies. The Fund aims to find value opportunities in quality equity income and stocks with strong balance sheets that can finance growth internally. The Fund selects equities with attractive relative valuations and strong underlying fundamentals across three strategies: BTS Dividend Aristocrats, BTS Equity Fortress, and BTS Highest Yielding Equity with a 10% allocation to BTS Covered Calls seeking to boost yield.
BTS’ View of the Current Economic Landscape
The U.S. economy exhibited a 2.4% annual growth rate in the fourth quarter of 2024, a deceleration from the previous quarter's 3.1% growth.1 The Atlanta Federal Reserve's GDPNow model, as of March 28, 2025, estimates a contraction of -2.8% for the first quarter of 2025, signaling a heightened probability of recession that our tactical models have picked up from a price standpoint in early Q2 2025.2
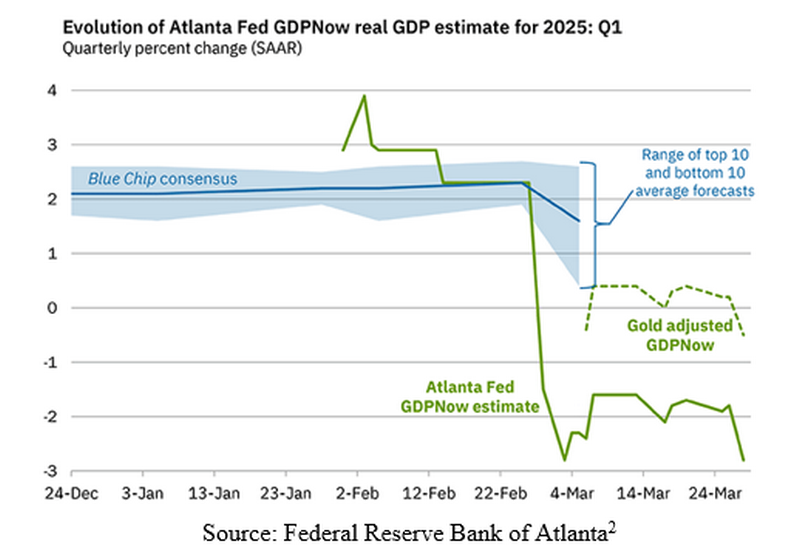
With Q1 2025 GPD set to be released at the end of April, a negative shock could further exacerbate the stock market decline and volatility we saw in Q1 and in early Q2. BTS views 1-2 interest rate cuts in the second half of 2025 as the most likely course of action by the Fed, however, we believe interim volatility caused by tariffs puts the Fed in a difficult position to cut interest rates, as they do not know the extent of how tariffs will affect inflation.
The Fed’s Uncertain Policy Path Ahead
As mentioned above, Trump’s protectionist trade policy is causing inflationary worries amongst consumers and the Fed. Consumer inflation expectations jumped to 5.0% in the March University of Michigan consumer survey, which was the highest level since November 2022.3 ‘Uncertainty’ has been the most used word by the Fed. At the March 19th Federal Open Market Committee (FOMC) Meeting, Fed officials left their previous projections unchanged due to a lack of clarity and signaled that “uncertainty around the economic outlook has increased”.4
During the March FOMC press conference, Fed Chair Jerome Powell said that the Fed can afford to wait before making policy changes, reiterating its data dependent approach, largely because the economy, particularly the labor market, is still in good shape.5 Despite inflation and growth challenges, the labor market has shown resilience. As of February 2025, the unemployment rate stands at 4.1% and employment has remained stable since May 2024.6
Although market participants expect that tariffs will disrupt economic growth and the labor market, as well as cause heightened inflation, the extent and duration of the disruption is largely unknown until new data comes in. The Trump administrations Department of Government Efficiency may also cause pressures on the labor market as government agencies and contractors are reorganized or eliminated.
BTS views this economic uncertainty as highly disruptive and could result in significant volatility ahead if prices increase and the economy weakens, which would result in a period of ‘stagflation’ that the Fed may not be equipped to handle. BTS’ current positioning in treasuries reflects the uncertainty and potential volatility ahead.
Conclusion
In BTS’ view, the Fed’s data dependency is causing widespread fear and pessimism in markets that could cause further volatility in both the bond and stock markets until new economic data is released and the Fed communicates a clear path forward. Short-term price shocks from tariffs may create an opportunity in treasuries, which the BTS Tactical Fixed Income Fund has tactically allocated to earlier this year and at the beginning of Q2 2025.
Thank you for investing with BTS. As we progress through 2025, BTS remains steadfast in our disciplined investment approach, emphasizing tactical bond allocations and strategically diversified value stocks with attractive dividend yields and balance sheets, which we believe will reduce volatility and drawdowns in client portfolios as economic uncertainty remains in the coming months.
Sincerely,
Vilis Pasts
Matthew Pasts, CMT
Isaac Braley
Henry Pasts
Co-Portfolio Managers
The material provided herein has been provided by BTS Asset Management and is for informational purposes only and should not be construed as an offer to sell or the solicitation to buy securities or adopt any investment strategy, nor shall this commentary constitute investment advice. BTS Asset Management serves as investment advisor to one or more mutual funds distributed through Northern Lights Distributors, LLC member FINRA/SIPC. Northern Lights Distributors, LLC and BTS Asset Management are not affiliated entities.
It should not be assumed that investment decisions made in the future will be profitable or guard against losses, as no strategy can guarantee future results or entirely protect against loss of principal. There is no guarantee that the strategies discussed herein will succeed in all market conditions or are appropriate for every investor.
Investors should carefully consider the investment objectives, risks, charges, and expenses of the BTS Tactical Fixed Income Fund, BTS Managed Income Fund, and BTS Enhanced Equity Income Fund before investing. This and other information about the Fund is contained in the prospectus and should be read carefully before investing. The prospectus can be obtained on our web site, www.btsfunds.com, by calling toll free 1-877-287-9820 (1-877-BTS-9820), or by calling your financial representative. The BTS Funds are distributed by Northern Lights Distributors, LLC, Member FINRA/SIPC. BTS Asset Management, Inc. is not affiliated with Northern Lights Distributors, LLC.
CITATIONS
1Gross Domestic Product (Bureau of Economic Analysis).
2 GDPNow (Federal Reserve Bank of Atlanta).
3Moderate US consumer spending, increasing prices raise specter of stagflation (Reuters)
4Federal Reserve issues FOMC statement (Board of Governors of the Federal Reserve System)
5The Fed – and economy – can still afford to wait patiently amid tariff uncertainty (Yahoo Finance)
6The Employment Situation – February 2025 (Bureau of Labor Statistics)
IMPORTANT RISK INFORMATION
Investing, including investing in mutual funds, involves risk, including possible loss of principal. There is no assurance that any strategy will achieve its investment objective. The value of fixed income securities will fluctuate with changes in interest rates. Defaults by fixed income issuers could also harm performance. Lower quality bonds known as “high yield” or “junk” bonds, present greater risk than bonds of higher quality, including an increased risk of default. An economic downturn or period of rising interest rates could adversely affect the market for these bonds and reduce the Portfolio Manager’s ability to sell its bonds. The use of leverage within a strategy will indirectly cause additional expenses and could potentially magnify the gains or losses.
Diversification does not ensure a profit or guarantee against loss. The BTS Enhanced Equity Income Fund is newly formed and has a limited history of operations.
Equity securities are susceptible to general stock market fluctuations and to volatile increases and decreases in value. The equity securities held by the Fund may experience sudden, unpredictable drops in value or long periods of decline in value. This may occur because of factors affecting securities markets generally, the equity securities of a specific sector, or a specific company.
ETFs are subject to investment advisory fees and other expenses, which will be indirectly paid by the Fund. As a result, your cost of investing in the Fund will be higher than the cost of investing directly in the ETFs and may be higher than other mutual funds that invest directly in fixed income securities. Certain restrictions of the 1940 Act may limit the Fund’s assets that can be invested in any one ETF. This limit may prevent the Fund from allocating its investments in the manner the Adviser considers optimal or cause the Adviser to select an investment other than that which the Adviser considers optimal. The strategy of investing in ETFs could affect the timing, amount and character of distributions and may increase the amount of taxes paid.
Covered call ETFs receive premiums from the call options they sell but limit their opportunity to profit from an increase in the value of the underlying stock. If the underlying stock declines more than the option premium received by the ETF, there will be a loss on the overall position. Covered call ETFs are also subject to the risks of investing in equity securities.
The Bloomberg U.S. Corporate High Yield Average Option Adjusted Spread measures the average option-adjusted spread of U.S. high yield corporate bonds over the yield of a comparable U.S. Treasury Bond adjusted to account for the potential for early repayment (call options) or early redemption (put options).
The Bloomberg U.S. Aggregate Bond Index is index used by bond funds as a benchmark to measure their relative performance. The index includes government securities, mortgage-backed securities, asset-backed securities and corporate securities to simulate the universe of bonds in the market. The maturities of the bonds in the index are more than one year.
The Bloomberg U.S. Treasury Bond Index is a broad measure of the performance of the U.S. Treasury bond market. It includes all publicly issued, fixed-rate, nominal U.S. Treasury securities with maturities of at least one year.
Volatility is typically characterized by market periods where asset prices deviate greatly around their mean prices.
Duration refers to a measure of the sensitivity of a bond’s price to changes in interest rates, typically expressed in years. It estimates how much a bond's price is expected to fluctuate as interest rates change.
The University of Michigan Consumer Sentiment Survey is a monthly economic survey that gauges consumer confidence regarding their financial situations and overall economic conditions. It provides insights into consumer spending behaviors and economic outlook.
Risk-adjusted returns measure an investment’s return while considering the extent of risk that was taken to achieve those returns.
Yield in reference to equities is typically the cumulative trailing 12-month dividend payouts expressed as a percentage of price. In reference to bonds, yield is the yearly interest paid to bondholders relative to the price paid for the bond.
Drawdown refers to peak to trough declines experienced by an investment over time.
BTS Dividend Aristocrats Equities are considered based on their ability to have increased year-over-year dividend payments for the past 10-15 years or longer.
BTS Equity Fortress Equities are considered based on the ability to finance internal revenue and asset growth without taking on excess debt as determined by the Adviser’s proprietary model.
BTS Highest Yielding Equity Equities are considered based on having the highest dividend yield in their respective sector.
BTS Covered Calls Invests in exchange traded funds (ETFs) that pursue a covered call strategy. Covered call ETFs invest in a portfolio of equity securities and also write, or sell, call options on their equity exposure in order to generate income from the premiums received from writing call options.
The S&P 500 Index includes 500 leading companies in leading industries of the US economy and is a proxy for the total stock market.
The Nasdaq 100 Index includes 100 of the largest non-financial companies listed on the Nasdaq Stock Market and is a proxy for innovation-driven sectors like technology, consumer services, and healthcare.
The Dow Jones Industrial Average includes 30 prominent, large-cap U.S. companies across various industries and is a proxy for the overall health and stability of the U.S. economy.
Magnificent 7 is a term coined to represent seven leading companies including Alphabet, Amazon, Apple, Meta Platforms, Microsoft, NVIDIA, and Tesla.
Stagflation is an economic condition characterized by a combination of stagnant economic growth, high unemployment, and rising inflation occurring simultaneously. It presents a challenging situation for policymakers, as traditional solutions aimed at reducing inflation (e.g., raising interest rates) tend to further slow growth and increase unemployment. Stagflation was notably experienced during the 1970s in many developed economies.
*Index returns are for illustrative purposes only and should not be construed as BTS Fund performance or performance achieved by any BTS client. More specifically, any reference to index returns during isolated or defined periods in time is for reference only and is not meant to imply index returns are indicative of actual returns achieved in any BTS Fund. Investors cannot invest directly in an index, and index returns do not reflect management fees, custodial fees or brokerage commissions, which vary depending upon the custodian chosen.
BTS Asset Management is affiliated with BTS Securities Corporation, member FINRA/SIPC. Securities are offered through BTS Securities Corporation and other FINRA member firms. Advisory services are offered through BTS Asset Management, Inc.
PAST PERFORMANCE IS NO GUARANTEE OF FUTURE RESULTS.
20250407-4374781
BTS Asset Management, Inc. ("BTS") is an investment adviser registered with the SEC. BTS' website is limited to the dissemination of general information regarding BTS' investment advisory services. The information on this website is for general informational purposes only and should not be construed by any prospective or existing client of BTS as a solicitation to effect transactions in securities. In addition, the information on this website should not be construed by any prospective or existing client as personalized investment advice. BTS’ investment advice is given only within the context of its contractual agreements with each client. BTS' investment advice may only be rendered after the delivery of its Form ADV Part 2 and the execution of an agreement by the client or investor. BTS' Form ADV Part 2 describes BTS' business operations, services and fees and is available upon request. All information contained on this website is subject to change without notice. The information contained on this website may include forward looking statements which are based on BTS' current opinions, expectations and projections. BTS does not have any obligation to update or revise any forward looking statements. Actual results could differ materially from those anticipated in the forward looking statements. Past performance is no guarantee of future results.